
Die ist die Fortsetzung einer weit fortgeschrittenen hochqualitativen Entwicklung, die leider nicht abgeschlossen werden konnte. Louis Dorren ist nach schwerer Krankheit in 2014 vestorben und seine Familie hat alles schnellstens entsorgt. Niemand wurde um Hilfe gefragt, obwohl genügend Interessenten da waren. - In 2020 und danach stellt sich solche Vorgehensweise der Erben oder Nachlassverwalter leider als ganz normal heraus - sofort alles entsorgen.
.
Die eigentliche Überschrift : Die Wahrheit der CD-4 Technik !
.
CD-4 in the 2000s
In 2007, 33 years after his first CD-4 demodulator, Dorren designed a new one with the technology of the day in mind. Dazu hat er 5 Aufsätze/Artikel verfaßt.
.
Installment I
High Performance 2007 CD-4 Demodulator - By Lou Dorren
It has been 33 years since the last CD-4 demodulator I designed. Sparked by the Quadraphonic Quad forum, I thought it an interesting idea to see how much of an improved demodulator could be designed with today’s vastly improved technology.
This is not just a paper exercise, but a full blown project to possible limited production. Now, off to the beginning. Figure 1 is the block diagram of the new demodulator. A larger version is on the last page.
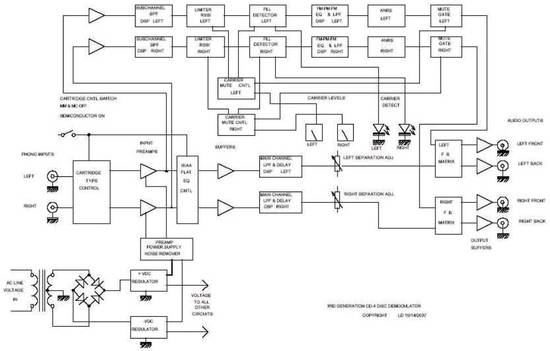
- Block Diagram of the New CD-4 Demodulator Fig. 1

One of the most critical subsystems in a CD-4 demodulator is the input preamplifier. Several important parameters are at play.
First is dynamic range. The difficulty is the R.I.A.A. equalization curve which can be considered frequency dependent pre-emphasis (record) and de-emphasis (playback). This curve has gain at very low frequencies (20Hz) and loss at very high audio frequencies 18KHz.
For all of you numbers fans, the formula to obtain the original RIAA playback curve :
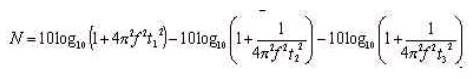
Where:
N=level in dB
f=frequency
t1=treble time constant, 75uS
t2=medium time constant, 318uS
t3=bass time constant, 3180uS
Here is a graphical representation of both the R.I.A.A. record and playback curves :
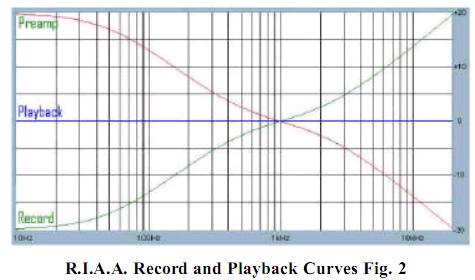
- R.I.A.A. Record and Playback Curves Fig. 2
As you can see there is a 40dB dynamic range (es sind ±20dB) on the curve itself. Added to this are the dynamics of the recorded content (das sind zusätzlich maximal 50dB), with cautions for extreme levels that might cause groove kiss (a condition where adjacent spirals on the record disk may overlap).
- Anmerkung : Zusammenfassend sind es etwa 90dB Dynamik, die der Phono-Entzerrer- Vorverstärker problemlos verkraften können müsste - besser natürlich mit etwas Übersteuerungsreserve von etwa +20dB und dann sind es schon 110 dB. Und das war und ist überhaupt nicht trivial.
The second parameter is noise or signal–to-noise ratio of the preamplifier and the third is the total distortion (harmonic, inter-modulation, transient inter-modulation).
Back in 1974, when Jerry O’Keefe and I were designing the QSI-5022, analog semiconductor technology was in it’s infancy. IC chips are generally made up of large numbers of transistors. In the 1970’s these were all a Bi-polar type structure. Bi-polar transistors have two polarity types, NPN and PNP.
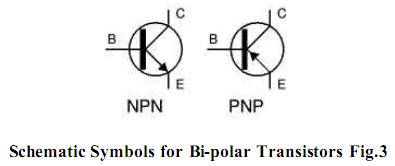
- Schematic Symbols for Bi-polar Transistors Fig.3
.
Es gab in den 1970er 2 gute CD-4 Demodulatoren
In circuit design, this can be very helpful because of the complementary nature of these types. Unfortunately, in the 1970’s NPN type transistor performance was very good, but PNP type was extremely poor.
This problem had a great effect on good amplifier design with the parameter affected worst being distortion. The QSI-5022 had the best performing phono preamplifier in the industry with distortion at .03%.
.
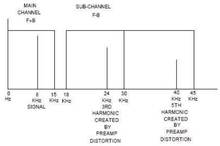
- CD-4 Frequency layout for Left Channel .03 Distortion (Right channel identical) Fig.4

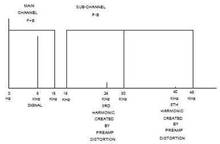
- Frequency layout for Left Channel .00003% Distortion (Right channel identical) Fig.5

The result was the best CD-4 demodulator at that time (SH-400, Heathkit, Southwest Technical Products).
Distortion in the preamplifier causes main channel to sub-channel cross talk. This is because the harmonics generated by the distortion end up in the sub-channel frequency range.
.
Figure 4 shows an 8 KHz signal in the main channel with .03% preamplifier distortion. The resulting harmonics end up in the sub-channel, with the third harmonic at 24 KHz and the fifth harmonic at 40 KHz.
This is interference in the sub-channel, by distortion products in the main channel. A good FM demodulator will reduce some of this interference, but not eliminate it.
Here we are in the year 2007, and integrated circuit technology has improved by several orders of magnitude (order of magnitude = X10 up and /10 down).
PNP transistors are now as good as NPNs, so that complementary designs are now implementable. The new CD-4 demodulator has a pre-amplifier with a distortion of .00003%. Figure 5 shows the harmonic content of the new CD-4 demodulator preamplifier.
- Anmerkung : Die letzte Aussage betrifft nur die "Kleinleistungstransistoren", nicht aber die Power-Transistoren der Endstufen der 1970er Jahre.
.
Das Rauschen, das aus dem Netzteil kommt
Even though most amplifier chips have extremely good common mode rejection (the ability of the amplifier to reject common noise on the power supply lines), but this is not enough in a CD-4 phono preamplifier.
In the new demodulator, the preamplifier power supply line uses noise cancellation amplifiers to reduce the noise to a level of –140dBV(100 nano Volts). This when coupled with the amplifier’s common mode noise rejection(100 dB) makes any power supply line noise unmeasurable(10 pico Volts).
Ein "semiconductor strain gauge type" Abtaster
(Those "semiconductor pickup" cartridges were made by Technics (By Panasonic). It is neither MM nor MC nor ceramic/piezoelectric, it is special. And you need a special Panasonic / Technics preamp !)
The input to the preamplifier comes from the phono cartridge control unit. This selects the input network for the cartridge.
For "semiconductor strain gauge" type, a DC bias voltage is applied to both channels and one of the channels is phase-inverted 180 degrees. This is done because the DC bias voltage can only be applied in one polarity, which makes the left and right channels out of phase. For the moving magnet and moving coil type, the DC bias voltage is removed as is the inversion.
Most phono preamplifiers use active R.I.A.A. feedback networks to get the proper curve. The problem with this technique is that the curve varies from chip to chip and with chip temperature.
This variation can affect the CD-4 Front to Back separation. In the new demodulator, a passive R.I.A.A. network is used with temperature compensation to insure consistent Front to Back separation.
The network is isolated from the low pass filter and delay stage by a low noise buffer amplifier which also adds some voltage gain to the main channel.
.
Installment II
.
THE NEW CD-4 PHONO PREAMPLIFIER
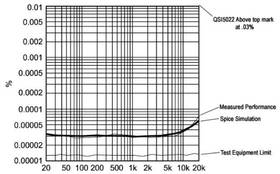
- Figure 6

From the first installment I indicated that IC technology had considerably advanced since 1974.
During the bread boarding of the circuit for the new demodulator I have made some defining measurements on the sub-systems of the demodulator. The preamplifier performance is excellent.
Figure 6 shows the predicted and measured Total Harmonic Distortion for the new preamplifier and a reference for the QSI-5022 preamplifier.
.
Das Tiefpaß-Filter im Main Channel
The next section to describe is the main channel low pass filter. This filter serves two purposes. First it eliminates the 30 KHz carrier and it’s side bands in the audio output (gemeint sind die Fron-Kanäle).
This may not sound significant but it is. The quality of today’s audio power amplifiers is so good, that they can easily amplify signals well above 30KHz. This means that this energy would be applied to the loud speaker and could burn out the tweeter and cross over network.
The L.P. filters second job is to provide the correct amount of time delay so that the main channel signals and the sub-channel signals arrive at the sum and difference matrix at the same time. This is critical for the most accurate front to back channel separation.
Was das Tief-Paß- Filter noch machen soll ..
In the design of appropriate filters for a given system it is necessary to determine the required characteristics for proper circuit operation.
This includes pass band frequency response (the frequencies wanted for correct sub-system operation), stop band frequency response(the unwanted frequencies). In addition, the pass band amplitude variation (how much unwanted level change in the pass band created by the filter) and the pass band phase variation(how much unwanted phase change in the pass band created by the filter).
Das "Dead Band" - wir sprechen von einem Gap = Zwischenraum
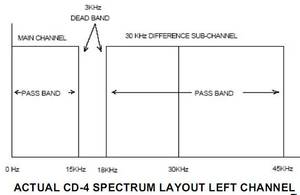
- Figure 7

The CD-4 system puts some vary stringent requirements on the audio low pass and sub-channel band pass filters. In the 1970’s, realizing the appropriate filter was a very expensive situation.
This is because there is a very small 3 KHz dead band area(frequencies between the stop band - "die Obergrenze" - of the audio filter and the stop band - "die Untergrenze" - of the sub-channel band pass filter).
Figure 7 shows the actual frequency requirements of the left channel of the CD-4 system. The right channel is identical.
.
- Anmerkung : Hier wird erstmalig verständlich dargestellt, daß die CD-4 Frontkanäle hohe Frequenzen nur bis etwa 15kHz aufnehmen können, weil danach (also oberhalb) ein Trennbereich von 3 kHz definiert ist. Weiterhin sieht man ganz deutlich, daß die Frequenzbänder des Rückbereiches (der hinteren Kanäle7Lautsprecher) teilweise nur 12 kHz breit sind.
.
Die Technik des Filter-Designs - also der Filter-Schaltung
Filters consist of a series of what are referred to as dipoles. These dipoles consist of a fixed pass frequency and a fixed notch frequency. By using multiple dipoles (referred to as "filter orders"), a filter design (also ein Filter "höherer Ordnung" mit entsprechend steileren Flanken) can be realized.
The problem in the CD-4 system is, that with only a 3 kHz dead band, the stop band slope (die Steilheit) of the filter must be very steep (from last pass frequency to first stop frequency, attenuation curve must be fast).
The appropriate filter for the CD-4 audio (Frontkanal-) low pass filter requires 8 poles. In 1970 the cost of this filter would have been well over $100.00.
So a compromise was made and a 2 pole filter was used. This would result in some reduction in separation between 10 and 15 KHz. Figure 8 is 1970 audio LPF.
.
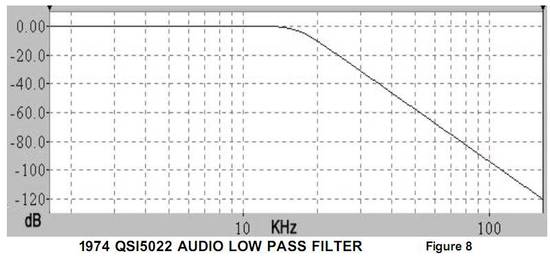
- Figure 8

.
- Anmerkung : Mit einem weniger steilen Filter geringerer Ordnung mußte der 3dB Referenzpunkt viel früher - also etwa bei 12 kHz - anvisiert werden, damit bei der Grenzfrequenz von 15kHz garantiert "nichts mehr" an störenden Signalen / Frequenzen vorhanden war.
.
With today’s high performance DSP technology, it is possible to achieve the full 8 pole filter requirement which will optimize the CD-4 performance. Figure 9 is the amplitude – frequency plot of the new CD-4 audio Low Pass Filter.
.
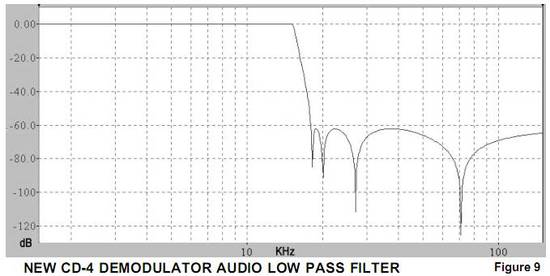
- Figure 9

.
This filter will improve high frequency separation performance of the demodulator. The filter input is driven from a ultra low distortion amplifier. The filter output is connected to the left channel Front-to-Back separation adjustment control.
- Anmerkung : Werfen Sie einen Blick links auf die senkrechte DB Skala. Es sind bei dem neuen Dorren-Demodulator jetzt mit echten -60dB steilflankig abgeschnittene 14kHz.
.
Installment III
.
The meat and potatoes section
This is the meat and potatoes section of the CD-4 demodulator. It is the 30 KHz sub-carrier recovery and demodulation section.
The performance of this section directly affects the overall performance of the CD-4 system. CD-4 uses two 30 KHz sub-carriers. One sub-carrier for each groove wall. Each sub-carrier is modulated with the Front minus Back difference signal for that side. The 30 KHz frequency was chosen to fulfill the Nyquist criteria for signal multiplexing.
The term multiplex means to send multiple types of information in the same signal. FM stereo and FM quadraphonic are both multiplex systems, as are all of the television systems world wide.
Electromechanical wide band transducers
Being a dual multiplex system that is recorded and played back by electromechanical transducers (2 channel wide band cutting head and 2 channel wide band phono cartridge), mechanical constraints put some interesting design problems in creating the CD-4 system. Figure 10 shows the base band groove layout for the CD-4 system.
.
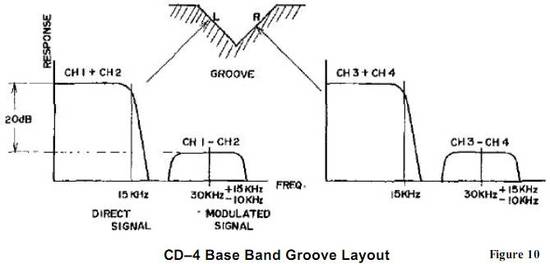
- Figure 10 (ein sehr oft gezeigtes Bild aus den JVC Broschüren)

Jeder CD-4 Hersteller hatte andere CD-4 Grafiken :
.
- Anmerkung : Von der obigen Grafik mit den Aufteilungen der Frequenzbänder gibt es mindestens 4 verschiedene Varianten, bei denen die Grenzfrequenzen wild getauscht wurden. Mal sind es 13 kHz, mal 14 und mal 15kHz Bandbreite für die Frontkanäle.
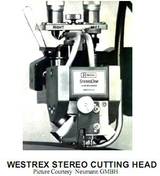
Jedenfalls hat das mit Hifi oder gar Edel-Hifi und schon gar nicht mit High-End irgendetwas zu tun. Die edlen Neumann Schneidköpfe waren mit einer irren Linearität bis 24 kHz spezifiziert und der Chef Georg Neumann nahm das wirklich sehr genau. Der originale Westrex Stereo-Schneidkopf ging nach den Unterlagen bis 18 kHz linear und fiel dann ab.
Darum standen bei den Japanern sehr oft die Georg Neumann Schneide- Maschinen. Wie weiter unten beschrieben wird, mussten die CD-4 Matrizen mit einem Drittel der 33 1/3 U/min Normalgeschwindigkeit geschnitten werden, um die 50 kHz sauber in die Rille zu schneiden.
.
- Figure 11

- Figure 12

To meet the information theorem, the CD-4 system has 4 audio inputs, therefore, it must have 4 transmission channels to deliver to 4 audio outputs.
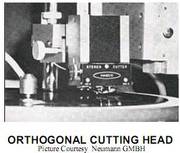
Starting out is the orthogonal record groove. This defines shape of the record groove as a 45° V. For the phonograph groove to meet the information theorem, it has 2 signal inputs, 2 transmission channels to deliver 2 signal outputs.
The first stereo cutting heads used a sum and difference technique to create the stereo groove. Using an algebraic sum and difference matrix, L+R and L-R signals are generated from the Left (L) and Right (R) audio signals.
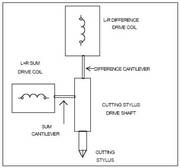
These are then fed to the orthogonal cutting head from 2 high power amplifiers. Figure 11 is a block diagram of this type of cutting head and Figure 12 is a picture of an actual head.
The L+R signal drives the stylus horizontally and if it is the only drive signal, the groove cut is monophonic.
The L-R signal drives the stylus in a vertical direction and if it was the only drive signal, the groove cut would be stereo with the Left and Right channels out of phase.
A Left channel only will cut a stereo groove with modulation on the Right groove wall only, and the Left groove wall silent.
As can be seen a Right Channel only will be just the opposite, with the Left groove wall modulated and the Right grove wall silent.
.
- Figure 13-15

Der CD-4 Schneidkopf muß die Rille extrem präzise schneiden
The problem with this type of CD-4 cutter head is the absolute precision between the vertical and horizontal drive sub-systems.
Every parameter, from frequency response, distortion, mechanical compliance, drive power and equalization must be absolutely identical. If all parameters are not the separation between left and right channel degrades. This showed up as loss of high frequency separation which starts at about 6 KHz. Maintaining separation to 50 KHz would be impossible with this type of cutting head.
Since the (very first or original) record groove is a V, some smart engineers at Westrex developed the enhanced V angle cutting head also known as a 45-45 cutting head.
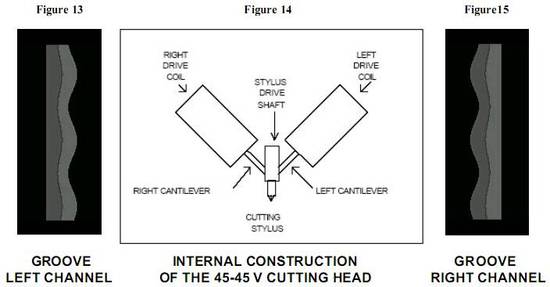
The 45-45 reference is because the angle between the 2 drive coils is 90 degrees and the stylus drive shaft is placed in the center of this angle, 45 degrees to either drive coil.
.
- Figure 16


This head construction eliminated the precision parameter matching and made the mechanical matching much easier. No sum and difference matrix is required which makes this type of head perfect for the CD-4 system.
A left channel only groove illustration is Figure 13 and Right channel is Figure 15. Figure 14 shows the internal construction of the 45-45 cutting head.
.
Ein Westrex und ein Neumann cutting head
Figure 16 is a Westrex cutter mounted on a cutting lathe, while Figure 17 is the Neumann cutting head that is used for CD-4 mastering and Figure 18 show the Neumann head mounted in a record cutting lathe.
In CD-4 mastering, the biggest problem is ultrasonic heating of the cutting head from the 30 KHz sub-carriers.
Most cutting systems use very high power (100 to 500 Watts per channel) to drive the cutting head coils.
The first is to control the carrier level to main channel level for each side of the groove wall. Figure 10 shows the level of the 30 KHz sub-carriers to be 20 dB below the maximum level of the main channels.
The very first JVC mastering system (mit dem Trick)
When the first CD-4 mastering system was built, the frequency response of the Neumann SX-74 cutting head was 24KHz with good separation at that frequency.
The phase shift was quite linear to 24 KHz as well. The problem, however, was obvious. How do you record frequencies up to 45KHz with a cutting head that only goes to 24KHz ?
The answer, reduced speed cutting. When new systems are in design, conservative implementation is the order of the day. Even though the Neumann Cutter is good to 24KHz, not having to record higher than 15KHz would be even better.
The first CD-4 mastering systems recorded at 1/3 speed which made the maximum recorded frequency 15KHz and both carrier frequencies 10KHz.
During recording the disk rotates and 11.11 RPM. When this disk is played back at 33.33 RPM the carrier frequency become 30KHz and the maximum frequency is 45KHz. Figure 19 is a photo of the first CD-4 mastering system.
.
Und noch weitere Modifikationen
Some significant equipment modifications were required to get this system to work. The R.I.A.A. curve had to be modified for 1/3 speed operation. The diameter eq for the cutting head position had to be modified and the NAB tape playback curve had to be scaled down to 1/3.
Fortunately, tape playback speeds were already available on the Ampex 440 four channel playback deck.
Overall system performance involves the differential between a perfect system (theoretical) and the actual system (empirical).
The perfect system would have flat frequency response, infinite separation, and unmeasurable distortion. Reality is quite different, but with appropriate circuit techniques, excellent performance can be realized.
Figure 20 shows the minimum separation of 15dB in the sub-carrier region from 18 to 45KHz. This cross talk manifests itself as incidental amplitude modulation to the FM demodulator on the opposite channel.
Wenn vom Plattenspieler die 30 kHz nicht angeliefert werden ...
There are several types of FM detectors. They include Discriminators, Ratio Detectors, Quadrature Detectors, Pulse Count Detectors, and Phase Lock Loop detectors.
CD-4 is considered a wide band modulation verses center frequency system. Of all the detectors mentioned, the ideal for CD-4 is "Phase Lock Loop" (PLL).
A PLL detector is just another FM detector. It's major advantage over discriminators, Ratio Detectors, and Quadrature Phase Detectors is that it is more linear (lower distortion) than the others.
All of these detectors suffer from the same problem. They want a constant carrier level with no variations (incidental Amplitude Modulation).
.
Die Macken/Schwächen der passiven Filter von 1974
This signal is the one that is fed to the sub-carrier recovery and demodulation section. Looking at the block diagram in Figure 1, this signal is first fed to a band pass filter.
In 1974 the only cost effective way to create a 30 KHz band pass filter, was to use passive components. This means inductors and capacitors. No transistors, op amps, or other active circuitry. To keep the costs down, the filter performance had to be a compromise.
Figure 22 shows the filter performance that was used with the QSI5022. Notice that the stop band slopes (stop band are the unwanted frequencies) are very broad and do not attenuate quickly.
.
Enorme Vorteile mit dem neuen steilflankigen 30kHz Filter
The new CD-4 demodulator uses state-of-the-art-processing techniques to deliver an ideal 30 KHz band pass filter.
The new technology eliminates inductors and capacitors, which also removes parameter drift due to temperature change. The stop band slope of the filter yields main channel to sub-channel isolation. Figure 23 is a graph of the performance of the filter.
Ziel war die absolut stabile Trägerfrequenz
The output of the 30KHz band pass filter is the sub-carrier and all of it’s side bands which also include amplitude variations of the sub-carrier itself, created by the record surface and playing diameter. In Figure 24, the illustration shows some carrier variation after the band pass filter.
After the limiter the signal level remains absolutely constant. This signal feeds the Phase Lock Loop detector with a full quality FM-PM-SSBFM signal.
Well that is it for this installment. Next one will describe the Phase Lock Loop and the ANRS subsystems. If any of you have questions, please post them. Enjoy!
Lou Dorren - Copyright Louis Dorren 2008
.
.
Installment IV
.
High Performance 2007 CD-4 Demodulator
Now that we have a good clean sub-carrier signal, a low distortion detector system is needed to convert the FM-PM-SSBFM signal into the Front minus Back difference audio.
FM and Phase modulation techniques were invented by Major Edwin H. Armstrong in 1938. He was responsible for the ratio detector and the differential pulse counting detector. He also discovered the ability to detect FM signals by using an AM detector slightly off tuned (slope detection). A few years later the FM discriminator detector was developed by Foster and Sealy.
Die Kennlinie des FM detectors und der VCO
All of these detectors have linearity which is measured by the S curve. The diagonal line of the S curve indicates the linearity of the detector. The straighter the line, the better the linearity. The longer the straight portion, the wider deviation can be linearly detected.
Most FM detectors have good linearity around the center of the curve, but start to round (deviate from linear) at the edges. Figure 26 shows the S curve of a typical ratio detector.
Der Phase Lock Loop (PLL) FM detector
Figure 27 is a block diagram of a typical Phase Lock Loop (PLL) FM detector. The PLL consists of a phase detector which is fed the FM signal to be detected as well as the output of the voltage controlled oscillator (VCO). The output of the phase detector feeds a low pass filter, which removes any input carrier frequency, leaving only the modulation signal.
This signal (referred to as the frequency error correction signal) is fed to the voltage control connection of the VCO, which forces the VCO to track the input FM signal. This same signal is the detected audio output signal.
The Phase Lock Loop (PLL) has an absolutely linear section from the lock to lock frequencies. These frequencies are the upper and lower ones where the PLL unlocks from the signal it is tracking.
The curve for the PLL is a Z curve, which makes it more linear for a wider FM frequency range. Figure 28 is the Z curve of the PLL.
Und jetzt eienweitere Reduktion des carrier-to-noise (CNR) ratio
The PLL has another advantage over other FM detectors. This is it’s ability to detect the full information bandwidth with poor carrier-to-noise (CNR) ratio.
This becomes very useful in CD-4 demodulation (US patent 3,886,312). The carrier level of the CD-4 sub-carriers is 20dB (100 times) below the peak level of the main channel audio.
This makes the raw CNR under the worst conditions, 20 dB. The PLL for the QSI5022 worked well with a CNR of 7dB. The PLL for the new CD-4 demodulator will work well with a CNR of 3.5dB.
Und noch ein weiterer Phasendetector
The basic PLL has no means of detected carrier indication. This is useful in identifying a valid incoming carrier.
It requires an additional phase detector (Quadrature phase detector) which senses when the VCO output has a 90 degree phase shift with regards to the input frequency. When this condition exists, the PLL is locked to the input frequency.
The output from the Quadrature phase detector is feed to a low pass filter and then drives a DC amplifier to turn on an LED indicator.
Wenn kein 30 KHz Signal erkannt wird ......
When no 30 KHz carrier is detected, the PLL audio output will be a loud random noise signal similar to an FM receiver not tuned in to a radio station.
The LED control signal is used to control an audio mute circuit that shuts off the two difference audio feeds when no 30 KHz signal are present. Figure 29 is a block diagram of the PLL for the new CD-4 demodulator.
The Front minus Back audio output from the PLL is fed to a passive, precision FM-PM-SSBFM de-emphasis network. This network uses high temperature grade capacitors and resistors to insure no characteristic variance over –40 to +125 degrees Centigrade.
By keeping this passive, small amplifier drift does not affect the EQ performance. As in the main channel, there is an identical 15.5KHz low pass filter after the FM-PM-SSBFM de-emphasis network.
Like the main channel, this filter performs the tasks of removal of ultrasonic PLL artifacts, phase and amplitude matching to the main channel, and delay signal matching to the main channel.
The Front minus Back signal is now almost reconstructed.
.
Die Rauschunterdrückung für die hinteren Kanäle (ANRS)
The last audio processing in the sub-channel is the Audio Noise Reduction System (ANRS). This sub system increases the dynamic range of the subchannel, while reducing the noise in the sub-channel.
The ANRS is a closed loop audio signal companding system. Companding is a composite word for compression-expansion. At the record end a level compressor is used to compress a large dynamic range into a smaller one.
When the audio signal gets to the playback end, an expander takes the smaller compressed dynamic range and expands it to its original one. Dynamic range is the level range from the loudest audio signal to the softest one based on the system involved. Figure 30 is a basic companding system.
High amounts of companding have some undesirable audio artifacts. Tracking linearity for the compressor and expander gets worse as a wider dynamic range is companded.
Large companding also has audio pumping effect from the gain control elements in the compressor-expander. The input-output graph for the basic compander is shown in Figure 31.
This technique is similar to Dolby C
The ANRS has a variation on the basic compander. It divides the companding scheme into two frequency bands. This technique is similar to Dolby C noise reduction with the exception that the frequency bands for CD-4 ANRS are different than Dolby C.
The CD-4 has a low mid compressor that has a mid band peak at 630 Hz and a high band compressor with a peak at 15KHz. Figure 32 shows the two compressor response curves. These curves actually yield a noise reduction of 10 dB at mid range and 15 dB at high Frequency.
These curves are the frequency response parameters that drive the dual band compander. Splitting the companding into 2 bands greatly reduces the audio artifacts from the compressor-expander subsystems.
At the same time it increases the mid and high frequency dynamic range of the Front minus Back audio signals and improves the signal to noise ratio of the sub-channels.
Figure 33 is the input-output characteristic of the CD-4 ANRS. In this graph, the centerline is the result of compression at the record end followed by expansion at the playback end.
Eine Schwäche des original CD-4 ANRS expanders
A problem does exist in the original CD-4 ANRS expander. The configuration of the expander is known as a parallel dual band expander. Figure 34 is a block diagram of this type of expander.
This type expander has variable phase distortion introduced into the difference signal by the additive controlled frequency response networks. The result is Front to Back separation that does not remain stable.
As the ANRS changes its expansion, the phase of the Front minus Back signal gets distorted. The result is that when this signal is applied to the sum and difference matrix, its phase does not match for proper addition or subtraction. This means that some Front audio is in the Back and visa versa.
Die Verbesserung mit meinem US patent 3902131
In evaluating the problem, I came up with a new type of expansion system (US patent 3902131) which uses algebraic subtraction for both CD-4 ANRS frequency bands.
This ANRS sub-system was the one used in the QSI5022.
Figure 35 is a block diagram of my tandem CD-4 ANRS expander. In the tandem expander, the main signal path is straight through two inverting amplifiers. An inverting amplifier is one where the output signal is 180 out of phase with input signal.
With two amplifiers in tandem the output is now in phase with the input. The control inputs are taken from the main input to the tandem expander. The 630 Hz mid expander is achieved by taking the control signal after the mid band frequency shaping network. The output of the shaping network is also fed to the audio input of the first gain controlled amplifier.
This amplifier is a non-inverting type (the output phase is the same as the input phase). Its output is subtracted from the output of the first inverting amplifier providing the mid band expander.
The high band (15KHz) expander has two identical frequency shaping networks. The first one is driven from the main input of the expander and is the control drive. The second frequency shaping network is fed from the output of the mid band expander.
It feeds the audio input of the second non-inverting variable gain amplifier. This output is subtracted from the second inverting amplifier, providing the high band (15KHz) expander. This tandem configuration improves the Front to Back separation by 8dB. Figure 35 is the block diagram of my CD-4 ANRS tandem expander.
.
And now for the humorous story … let me set the stage.
JVC and its parent company Panasonic (Matsushita Electric Corp) are in the process of trying to "woo" RCA and Warner Brothers records to endorse and use the CD-4 quadraphonic record system.
The problem that had arisen was that of the number of disk plays before the record was unusable. RCA had set the standard in the stereophonic disk (Figure 36) and expected the same results from the quadraphonic disk.
The standard was to play the record 100 times with a conventional low-quality record player using a ceramic cartridge, tracking at 4½ grams.
Once the record had been played this many times, then it should be able to be played back correctly on a four-channel turntable with quadraphonic cartridge and the performance should be the same as an unplayed quadraphonic record.
The problem was that in the Japanese tests, they were getting 30 plays and in RCA’s tests, they were getting about 45 plays.
Absolut unbefriedigend und nicht lösbar
This was unsatisfactory and the problem was insurmountable. I was notified by one of the people from Panasonic, that this problem existed and I requested that they send me some of the disks from RCA Indianapolis, that had been played 100 times or more for me to evaluate.
When I received the disks, I visually inspected them and noticed something wrong. As a mastering engineer having cut many master disks, there’s a certain pattern and sheen that you expect to see from a record and the quality of the sheen changes as the record is worn.
The change, however, is very gradual and goes from a very high-polished mirror appearance to a soft gray appearance. This is what you expect from a standard stereo LP.
Ein abgespielte CD-4 Platte sieht anders aus
The CD-4 LP, however, has a slightly different look to it.
An unplayed CD-4 disk has what is known as a Beckman-Meyer (Figure 37) appearance. This is because there are two 30 KHz dub-carriers in the record groove.
The Beckman-Meyer pattern has been used for years to give the mastering engineer a good idea of how well his cutting system is performing without having to actually play back the disk.
Die Folie visuell prüfen, ohne sie zu zerstören
When you cut a master LP, you cannot play the disk so it will remain virgin going to the record pressing plant. A 12” LP is mastered on a 14” blank (die Leer-Folie) and the mastering engineer will generally run a Beckman-Meyer pattern (ein Probeschnitt bzw. eine Probe-Rille)) at about 13½” to confirm the quality of this cutter before actually cutting the master.
When I looked at the disks sent to me from RCA, I noticed that the disks didn’t look like a CD-4 disk that had been worn.
They looked more like pavement that had been traveled on by trucks many times, having a light gray appearance of used gravel. This, I thought, was quite strange.
I took one of the disks and put it on my CD-4 playback system with our new high-quality demodulator and a Technics 451C Semiconductor Strain Gauge cartridge, tracking at two grams with a Shibata stylus.
The result was awful, nothing but horrible breakup noise, very little carrier, and no quadraphonic reproduction. The characteristic of the noise was different from the noise that you hear from a destroyed CD-4 groove.
It was more like the noise that you would hear if the Carrier Level Control (CLC) had gone bad in the cutting system.
I had experienced this at the JVC cutting center during some test masters, so I was familiar with the sound. I thought for a moment, how could this be? Production disks would have never gotten this far with that problem existing (Figure 38).
Eine chemische Reinigungsmethode muß her
I asked the chief engineer of my company, Gil Gibson, whose background is in chemical engineering, to create a cleaning solution that I could use to clean the disk.
I had indicated to him that I thought there may be some cracks in the actual disk surface, where dirt adhered and I needed some form of solution that would either liquefy the dirt or elevate it from the cracks.
About two hours later he brought me a test solution and I applied to the surface of the disk with a lint-free cloth we use in the laboratory called a Chem-Wipe.
I cleaned about one inch of the diameter of the beginning surface of the disk. I dried the disk off with another Kimwipe and put the stylus down on the disk to let it play.
Auch hier war die Wiedergabe fürchterlich
Playback was awful, just as bad as before cleaning. As I was doing this, I got a phone call in the lab, so I turned the volume of the audio amplifier down and took the phone call. While I was talking on the phone, I was watching the turntable and all of a sudden about ¾” into the record, the stylus popped out of the record and skidded all the way to the middle of the disk.
Concerned about damaging my Shibata stylus, I Quickly lifted up the tone arm and put it in the tone arm holder and finished my phone call.
Ein großer Schmutzklumpen an der Nadel
When I went back to see what had happened, I noticed a gigantic dirtball around the stylus. I removed the dirt so that the stylus was clean and put it back at the beginning of the record, turned up the volume, and low and behold the record played perfectly, until it got to the spot where it jumped out of the groove.
I then applied the cleaning solution to the entire surface of the disk and carefully dried it off with another Kimwipe and played the whole disk with the volume down.
Jetzt genauer nach dem Schmutz suchen
After every two tracks on the disk, I would lift up the arm and clean off the dirtball from the stylus. Completing the first cleaning play, I decided I would play it one more time to see if there was any more residual dirt remaing.
The second play had a little ball at the very end. Now the final test, I turned the volume up and played the whole record.
It was perfect! There were no carrier dropouts, no burst noise, and fantastic front-to-back separation.
Bob Maddox at Stanford University und sein "electron microscope"
I knew there was something going on, but I needed to investigate further. RCA had sent me a number of disks. I cleaned two more and the result was the same.
I then took one of the clean disks, and one disk that had never been cleaned and went to see a friend of mine, Bob Maddox, at Stanford University.
Bob was a Professor of Chemical Engineering and he had access to a very nice electron scan microscope.
I told him that I wanted to see what was going on in the grooves to get an idea of exactly what was happening.
Aufnahmen mit dem REM ( Raster-Elektronenmikroskop)
The process of doing the electron scan microscopy is very complex.
You must first make a sample to be scanned. That sample then needs to be metal sputtered with a one-or-two molecule thick layer of metal.
The sample is then put in to the scanning chamber and is scanned in various magnifications. We did that and saw what the dirt was doing to the CD-4 record groove.
Das Ergebnis und die Erkenntnis
Records, by their nature, are made of vinyl or some form of polycarbonate plastic. When a stylus is playing this groove, it acts like a young person rubbing his feet on a rug floor or holding a plastic rod and rubbing a cloth on the rod, creating static electricity.
This static electricity continues to build a charge on the disk surface. The static charge attracts all of the dirt and dust that is in the air to the surface of the record.
Because the wavelength of the 30 KHz sub-carriers is so short, it makes very rapid hills and valleys in the groove wall.
As the stylus from the regular phono player plays this groove, it pushes the dirt into the valleys of the sub-carrier like a pavement steamroller.
With each additional play, more dirt fills up the valleys until the dirt is as high as the peaks, essentially hiding the sub-carrier from the playback stylus (Figure 39).
When the disk is cleaned, the Shibata stylus, because of its shape in the front, acts like a snowplow and physically digs the dirt out of the valleys. This returns the groove to its normal condition, allowing it to play perfectly.
Aufgeschrieben und an Panasonic, RCA and Warner Brothers geschickt
After confirming this, I wrote a paper that I delivered to Panasonic, RCA and Warner Brothers, as well as the IEEE, titled “The Dorren Effect of Carrier Recovery Amplitude Perturbations.”
I then called RCA and Panasonic and let them know that I had figured out the problem and I could demonstrate the solution. We all met one week later at RCA’s plant in Indianapolis.
Meine Demonstration und Beweisführung
We set up all of our equipment, and I brought out the disks that RCA had sent me to demonstrate. The head of RCA’s engineering division, Rex Isom, said, “No, I don’t want you to use those disks, I want you to use these” and handed me a new set of disks. I was the only one in the room who was confident.
All of the people from Panasonic had facial expressions of “deer in the headlights”. I was sure they were convinced that this would not work and they would not gain acceptance from Warner Brothers or RCA. Also watching this demonstration were Jack Holtzman and his brother Keith, from Warner, Electra, Atlantic Records (WEA). Jack was the Chairman of Board.
Nur noch eine Tasse Coffee und ein Donut - aber dann
I told everyone to have a cup of coffee and a donut while I prepared the demonstration. I took one of RCA’s records, cleaned it, put it on the turntable, played it with the volume off, and removed the expected dirtballs from the stylus.
In about ten minutes I said to everyone, “Ok, let me demonstrate CD-4 to you.” I took one of the records that had not been cleaned and played it and it sounded awful.
I then took the disk that I had cleaned, put it on the turntable and played it. It was perfect!
Rex then asked me to clean a disk that he was holding. I said “sure” and proceeded. After the cleaning play, I turned up the volume and the disk also played perfectly.
500 mal gespielt und immer noch in Ordnung
Rex announced to all of us that this disk had been played 500 times at 4.5 grams. Everybody from Panasonic and JVC had a big smile of relief on their faces and the people from RCA and Warner Brothers were shaking everyone’s hands. That’s where the agreement was made to support the CD-4 Quadraphonic disk system.
Well that is the story. You are probably saying “interesting, but where is the humor” ? Well it is hidden in the story. Read it again and see if you can find it. If you think you found it send me a private email with the answer. In two weeks I will reveal it.
Well that is it for installment 4. Next time I will discuss the sum-difference matrix and the RSSI system. Lou Dorren
.
Installment V
.
High Performance 2007 CD-4 Demodulator
The last sub-system in the sub-channel is the carrier "Received Signal Strength Indication" (RSSI) dropout compensate and mute system. This system identifies the carrier signal level and prevents the output of no signal demodulation noise when there is a carrier loss or the carrier gets below the demodulation threshold.